Few months ago, I posted on the USDT.D (Follow the money if You wanna hit your target).
According to the CryptoAsset market, USDT.D is 7.86%, so far. But if we add $USDC.D to this chart, what is not insignificant because they are predominantly used in DEXs1, we reaching 10.22% . Knowing that $BTC.D is at 49.86% ; $ETH.D at 19.03%.
The TOTAL represent quite 80% of the Market… Do you need me to draw a picture of what I think about the rest ?
Because this chart has only existed for 5 years, the first 2002 candles of the period ended just a year ago, THE last element used to combine and trigger BLACKSTRAT3 Signal (14.16%), which complete the first signal of stochastic rejecting to push this dominance higher.
In any case, when you are in an MarkUp channel, the probability of breaking it out to the downside could ONLY confirm the end of a trend, except for what you call a deviation (which in my language means a mSOW4).
You’ve understood it well! A decrease in stablecoin dominance simply means their use in investment, or rather their re-injection into Cryptoassets market !
Even if this Chart showing a Ribbon5 reversal (“BearSIG 16“), even if it setup a potential exit, with a potential desire to kick the 200, IT WILL TAKE TIME to exit from this Failed Structure because to confirm this exit (once Major SOW7 happen), we need to see at least a pull back on the low Fork trendline (ICE8), no more than its MidRange.
The only indication in this chart, is the volume decreasing for a potential spike/squeeze before any logical construction (because Weiss indicator bullshiting at this point!).
In the assumption of lapping the 200, according to BlackStrat Setup and it’s logic continuation of this local trend, the opposite signal (yellow candle) is highly likely to confirm if there will be a rejection or not !
Aesthetically this MarkUp is so perfect, and because of the BearSIG, I won’t say if we gonna make another lap to continue the progression!
Of course, I would have preferred to see an upthrust before finding ourselves in front of this exit trap. Not that the last movement is too weak or too shy, which indicates the difficulty in a chaotic market progression. What is important in an increase or a decrease is not the trend itself, but rather the strength of the movement.
From Weekly to Daily
#CRYPTOASSETS #BLACKSTRAT #DOMINANCE – $USDT.D+$USDC.D, D
While in traditional markets, the construction of forks with different phases (from A to F) is obvious, in crypto, MM9 cause prices to fluctuate in all directions, leaving a lot of liquidity in both sides. This makes TA10 more complicated.
As easy as it was to understand the Weekly TF11, it gets more complicated on the Daily one.
As I have often repeated, the cryptocurrency market is very young, with low liquidity, and therefore very volatile. There is a lack of rules, almost no discipline, which sometimes shows the intensity of the movements. Furthermore, when Institutional need to cover margin call on classics they don’t hesitate to purge their “crypto” positions, as we saw it in the past.
According to AR12 as of 15.08.22 (ICE level), we currently working on the same level. If we consider the Spike as of May 22 with a kind of TPO13 leaving (9%), we can appreciate a double bottom. BS Study14 displayed 4 bearish divergences, plus 3 “Yellow candles”, if I consider the Spike as of 10.03.23 being a LPSY15, we just slid into a new Fork, more practicable. I could not exclude a 3 taps (9% again). It become obvious.
Furthermore, We broke 8% (with BlackStrat “bull” force confirmed as of 25.04.22 – 7.74%), we might “BackUp” at least on this zone to confirm the continuation of the trend or break it to change the character. And since it’s in this area that our 200 Weekly is located, it would suit us well.
“Surgically”
 #CRYPTOASSETS #BLACKSTRAT #DOMINANCE – $USDT.D+$USDC.D, D
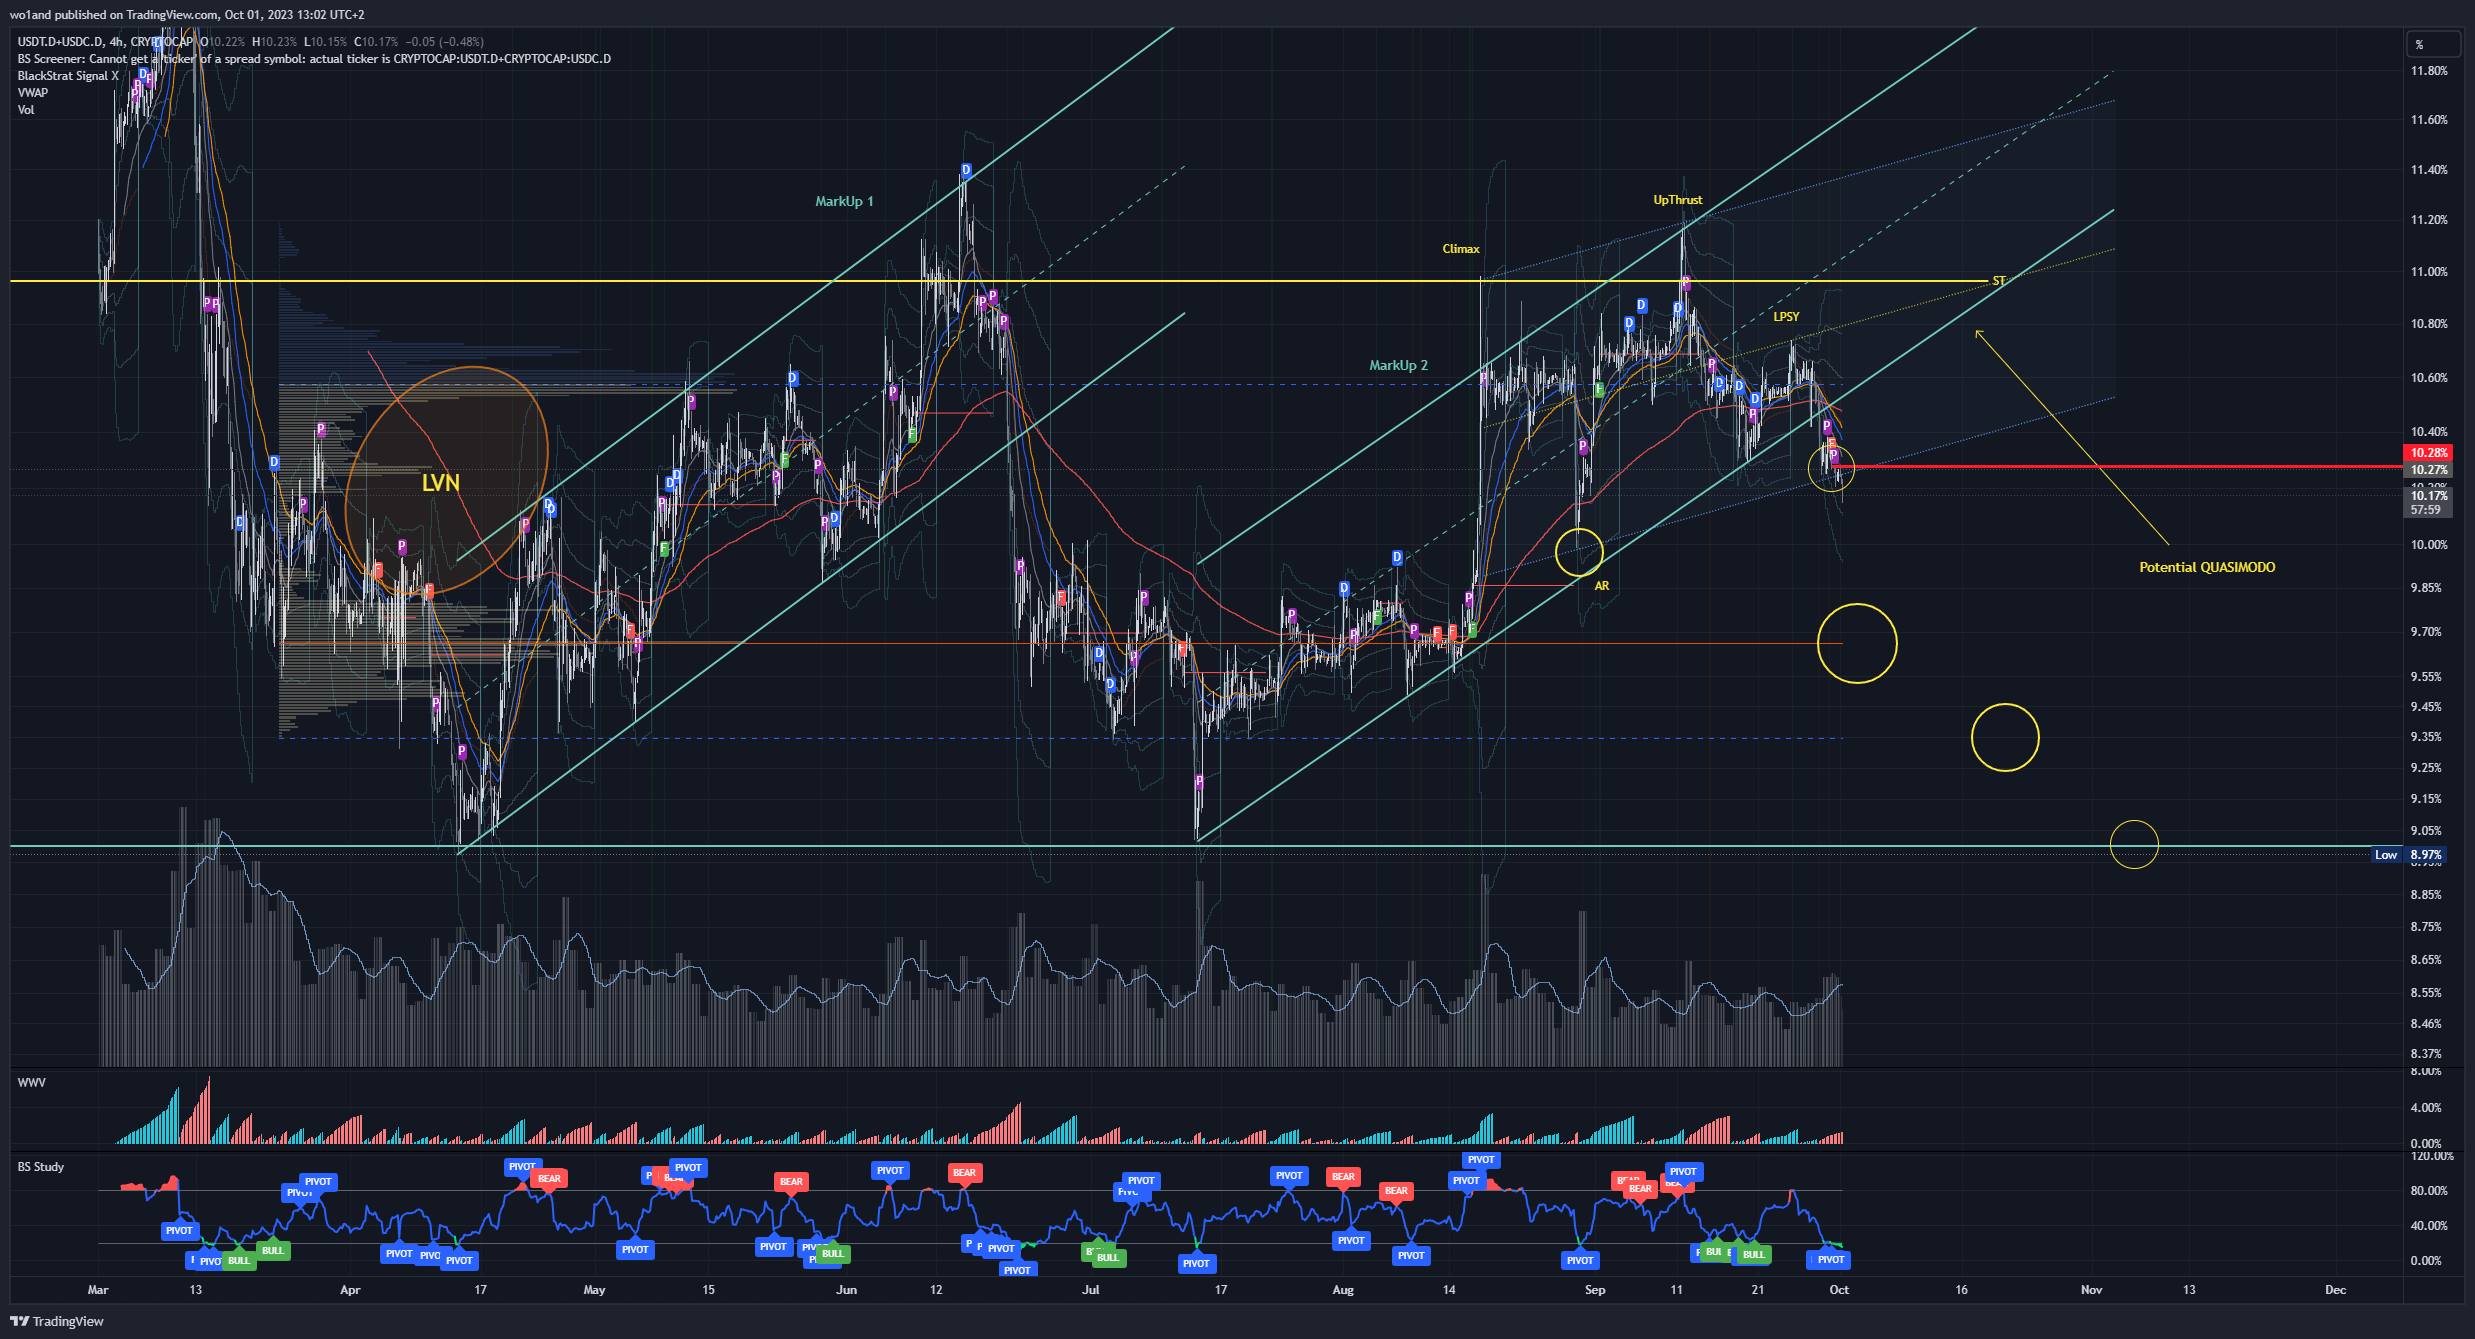
Distribution or Accumulation ?
As much as MarkUp 1 is clear and straightforward, MarkUp 2 seems to have been rushed and “destroyed”, with a possible QUASIMODO leaved ! This pullback below the VAH16, with that kind of LVN17 that even a dentist would think twice about how to fill it, confirm that we are still in a PHASE B.
If so, POC18 level (9.66%) is inevitable ; VAL (9.35%) could be lapped, and I don’t exclude squeeze a Spring below 9% at most 7.74% (200 Weekly) with a pull back. This would be a PHASE C, according to push dominance above 11% quickly. Otherwise, it will be a never-ending day (new lap till ST19 level).
Below 9%, I would be like a Mowgli with this important question if I should be back to the Jungle once I leaved it!
We have time. “Yellow candle” H4 triggered20 (10.28%) and POC is a magnet. This could confirm my BTC projection (BTC – IF YOU WANNABE A BULL FOR A MICROSECOND – BlackSquare).
Conclusion
What could be the catalyst the confirm me the end of this tremendous Bear ?
On fundamentals ! I am still negative on this market till we did not wash it definitely ! 1.8M tokens, over 700 exchanges…. don’t you think it’s a lot ?
There will be projects that will be disappear once $BTC will break 25k. 20k will be catastrophic
we should try the be more objective on :
- SMO might end in Ukraine by December.
- Taïwan – China will the next step !!!!!!
- ECOWAS (G7) vs. Free African countries (BRICS)
- US elections 2024
- Binance issue + different new cases to come…
- MICA law + CBDC attempt (typically test the market to try to interfere).
I am not talking about my POV over dislocation of the Europe. And more much to come in the next years. I don’t know what is the global current use of DeFi tools. I stopped at 8% worldwide…. We just entered in the Digital AGE and decentralised systems become usual. The Adoption will take some time.
- Decentralized Exchanges ↩︎
- exponential moving average over 200 periods ↩︎
- BlackSquare professional tools for trading ↩︎
- minor Sign Of Weakness > Wyckoff methodology ↩︎
- combination of 3 EMAs (20; 34; 50) ↩︎
- BlackStrat signal indication ↩︎
- Wyckoff method ↩︎
- Wyckoff method > low part of the Fork ↩︎
- Market Makers ↩︎
- Technical analysis ↩︎
- timeframe ↩︎
- AutoReaction (Wyckoff method) ↩︎
- time price opportunity ↩︎
- BlackSquare professional indicator ↩︎
- Last Point of Supply > Wyckoff method ↩︎
- VAlue Hight (volume profile) ↩︎
- Low Volume Node (volume profile) ↩︎
- Point Of Control (Volume profile) ↩︎
- Secondary test (Wyckoff method) ↩︎
- BlackStrat signal tool ↩︎