Our skills and expertise to help you make the most of your financial wealth. We use effective strategies to ensure that your assets are valued appropriately and managed in a way that aligns with your goals.
In today’s rapidly evolving financial landscape, digital assets are becoming increasingly important. Our investors choose us because they trust our ability to navigate this new terrain with innovative technology, proven experience, and a deep understanding of the market.
We’re committed to providing you with integrated solutions that mitigate risk and optimize your capital efficiency. With our knowledge, skills, and cutting-edge tools, you can rest assured that your financial future is in good hands.


Jhon Smith
crypto specialist

Lebedev Alex
crypto specialist

Ivanov Maxim
crypto specialist
FAQ
Install BlackStrat tools on your TradingView Platform?
You don’t have an account TradingView?
Need to open an account. Link
NOTICE: You don’t need to pay a subscription to use BlackStrat Tools
You already have an account TradingView?
Request your one week trial
Fill up all informations requested.
Once we have received your request, you will receive a message from Sales Department confirming your account
TradingView get the access to BlackStrat tools
Go to your application TradingView > Product > Chart
On Chart go to Indicators
Choose Invite-only Script
Install your BlackStrat tools
How to Use BlackStrat Signal Analyzer?
Description:
“The Ribbon”
- EMA 20: Exponential Moving Average of the last 20 periods (modifiable in “Inputs”).
- EMA 34: Exponential Moving Average of the last 34 periods (modifiable in “Inputs”).
- EMA 50: Exponential Moving Average of the last 50 periods (modifiable in “Inputs”).
- EMA 200: Exponential Moving Average of the last 200 periods (modifiable in “Inputs”).
Strategy:
- Entry Price: The level at which a potential buying or selling force is activated once triggered.
- Buy: Label of the execution of a definitive signal validating a bullish trend.
- Sell: Label of the execution of a definitive signal validating a bearish trend.
- Long Bar Color: Color of the “Buy” Candle.
- Short Bar Color: Color of the “Sell” Candle.
- Stop-Win Long: Your adjustable STOP-Win level in “Inputs” once the “Buy” Candle is triggered in %.
- Stop-Loss Long: Your adjustable STOP-Loss level in “Inputs” once the “Buy” Candle is triggered in %.
- Stop-Win Short: Your adjustable STOP-Win level in “Inputs” once the “Sell” Candle is triggered in %.
- Stop-Loss Short: Your adjustable STOP-Loss level in “Inputs” once the “Sell” Candle is triggered in %.
Signal 1 (Label):
- If BULLISH: When the “ribbon” is positioned from down to up 50, 34, 20 but below 200.
- If BEARISH: When the “ribbon” is positioned from up to down 50, 34, 20 but above 200.
Signal 2 (Label):
- If BULLISH: When the “ribbon” is positioned from down to up 50, 34, 20 but above 200.
- If BEARISH: When the “ribbon” is positioned from down to up 50, 34, 30 but below 200.
Background Color: Color behind the Signal on the chart indicating bullish / bearish evolution
BS Analyzer Study included in the “BlackStrat Signal Analyzer”:
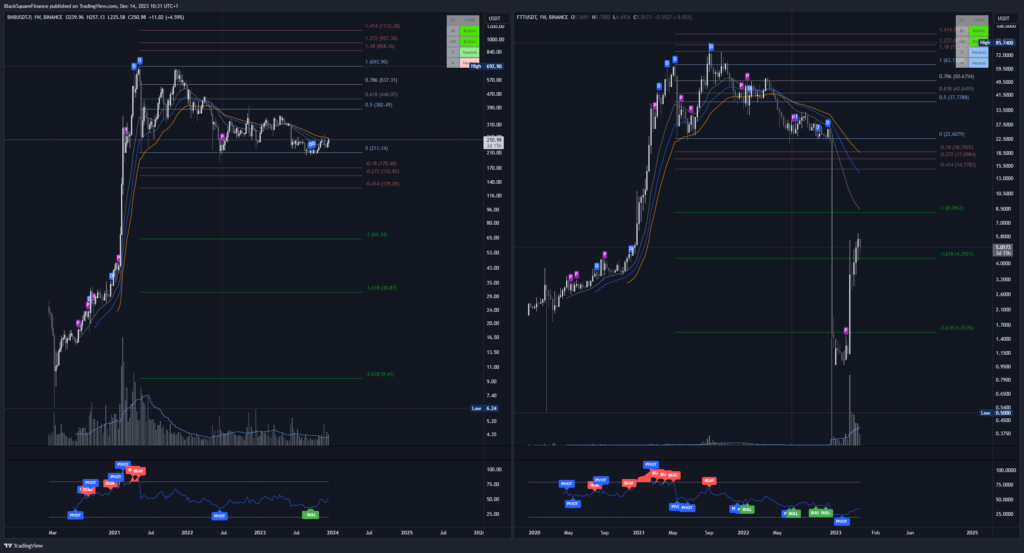
- DIV RSI (label): RSI Divergence (can be hidden or shown)
- PIVOT RSI (label): Pivot indicator
- Div R color: Background candle color of “DIV RSI”
- Piv R color: Background candle color of “PIVOT RSI”
- Bar Color 0: Color of candles when Price is OVERBOUGHT (above 80, but can be modified in “BS Study”)
- Bar Color 1: Color of candles when Price is OVERSOLD (below 20, but can be modified in “BS Study”)
- Long SL (label): Automatic display label when price crosses EMA 200 or EMA 20 crossing EMA 50
- Short SL (label): Automatic display label when price crosses EMA 200 or EMA 20 crossing EMA 50
- Long TP (label): Automatic display label when EMA 20 crosses EMA 50
- Short TP (label): Automatic display label when EMA 20 crosses EMA 50
- Labels: Price displayed on chart of your strategy
- Lines: Levels displayed on chart of your strategy
Alerts Setup on Asset
- Chose your timeframe before setup
- Add Alert on BlackStrat Analyzer”Any alert() function call” will trigger 16 conditions displayed on your chart setup:
- % Long StopLoss
- % Long Target
- % Short StopLoss
- % Short Target
- BEAR SIGNAL 1
- BEAR SIGNAL 2
- BUY
- DIVERGENCE RSI
- PIVOT RSI
- SELL
- STOP LOSS LONG
- STOP LOSS SHORT
- STOP WIN LONG
- STOP WIN SHORT


