#CRYPTOASSETS #BLACKSTRAT – $BTC, H4
REMEMBER THE WICK as of 17.08.23.
I told that we will make a 0.618-0.7861 of this wick to confirm any current rejection to get more lower.
#WORKSHOP
This is very important to understand what is the difference between when PA2 make a bottom and the second is at highest level ; and when PA make a bottom and the second bottom is lower than the first one ! In the first case the trend is not over and will locally change its direction before continue to follow the trend again. When the second case happen, we have a Climax3, then PA is moving in a range till MM4 to push to test the presence of the opposite part. In our case we are talking of an eventual Spring (PHASE C), once done, rejection is obvious and take the opposite direction. There is a LPS5, then JAC6, then BU7, and only when all these conditions were fulfilled, you can temporally fast your seatbelts and wait till the end of the next CHoCH8!
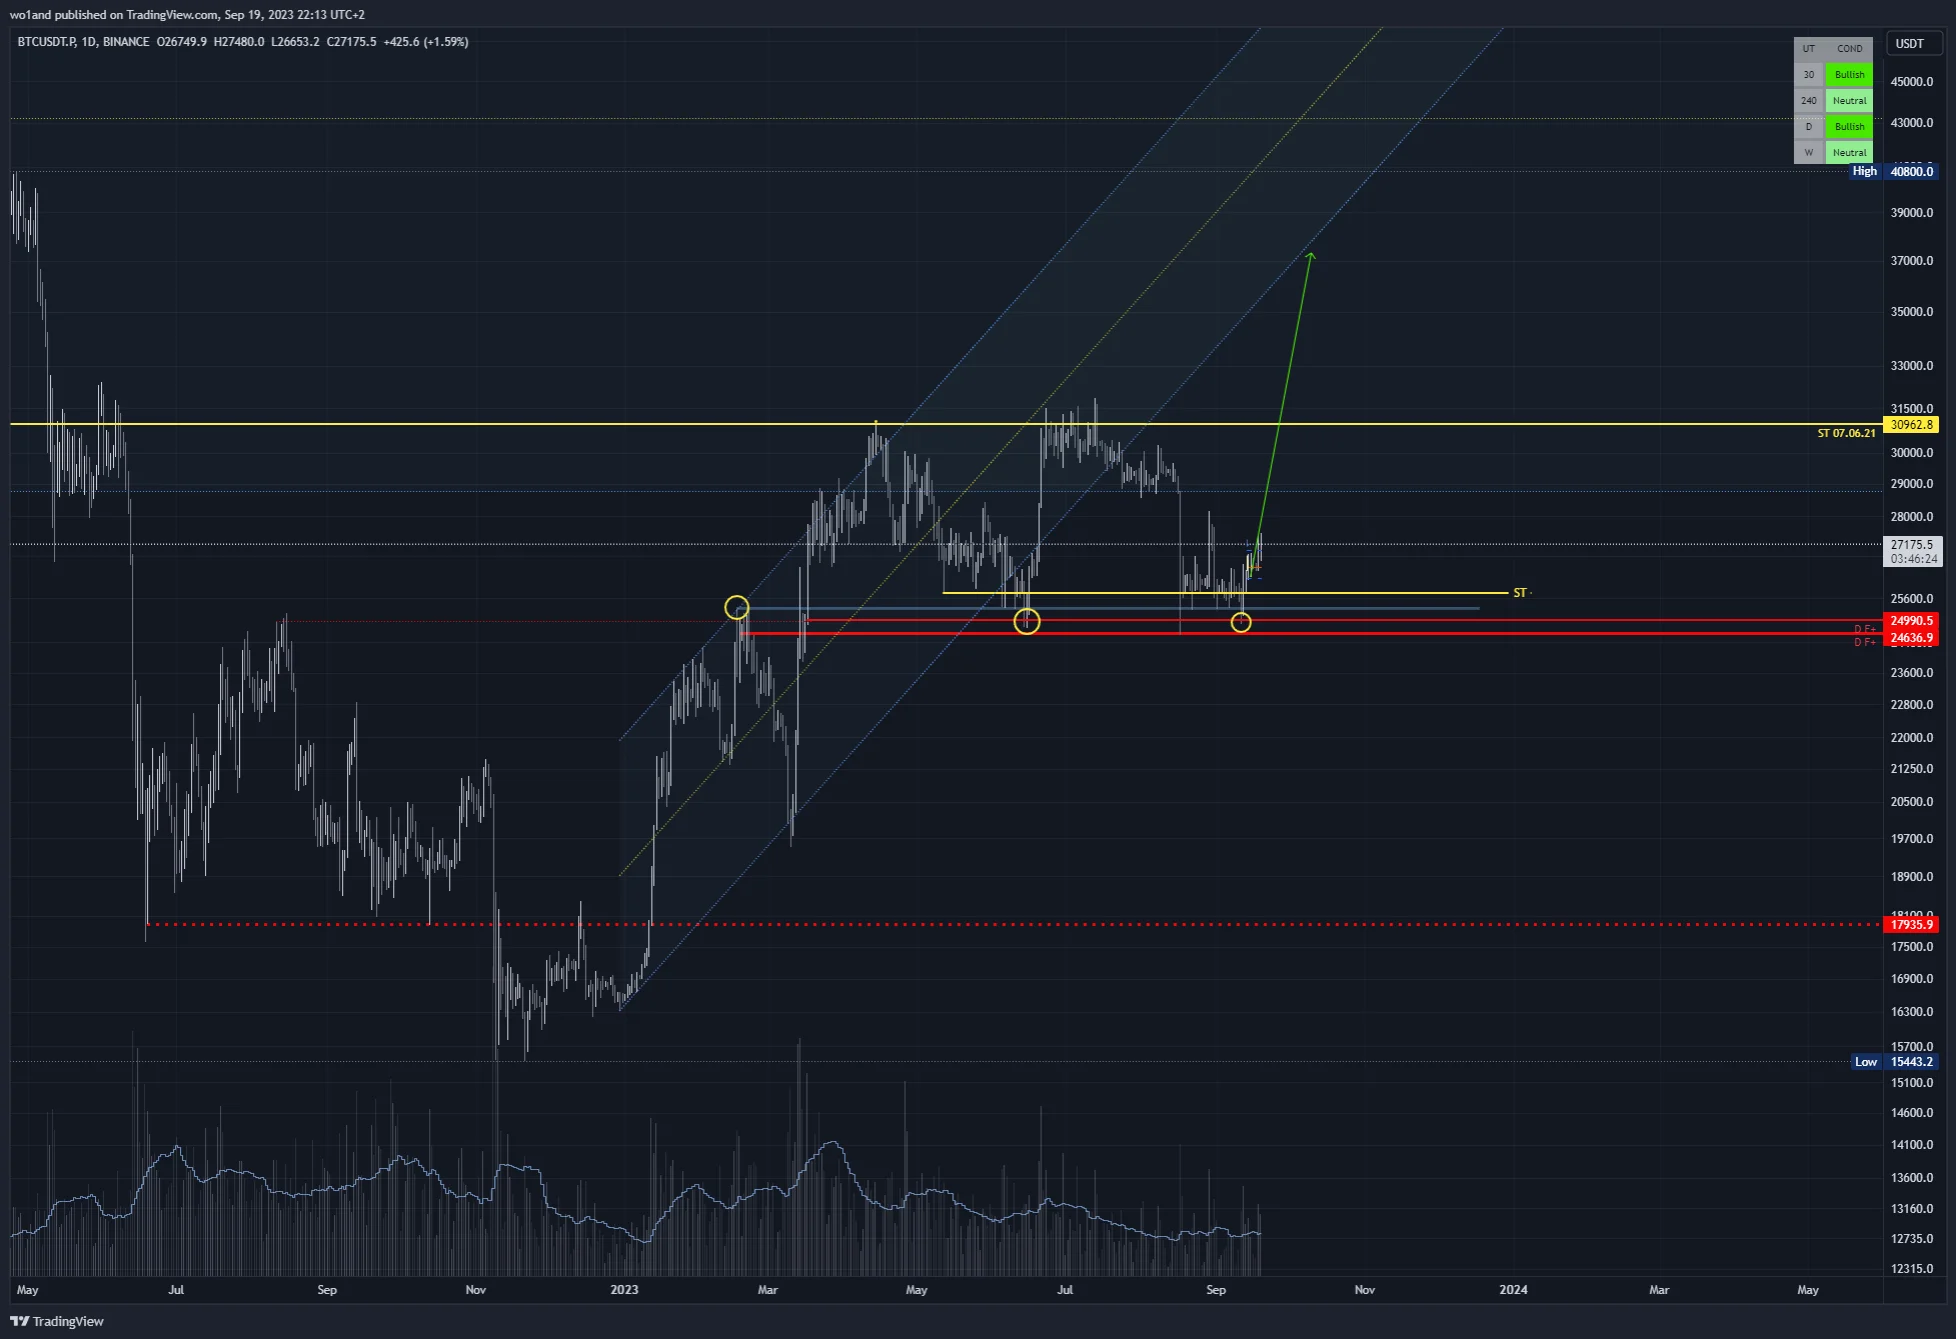
#CRYPTOASSETS #BLACKSTRAT – $BTC, D
In this case, as of 17.08.23, PA has kissed the trendline, and you can remark that this level corresponding to Daily #Blackstrat signal as of 18.02.23 (24636$).
#CRYPTOASSETS #BLACKSTRAT – $BTC, D
Regarding this, we have 2 potential scenarios.
1. #BlackStrat Signal as of 23.06.23 rejected the PA to push at highest level, which confirm the FORK is not definitely done. If so, spike as of 29.08.23 kicked POC9 level (28034$) was not a LPSY10. and ABC11 move got its potential to get seek VAH12 @ 29600$.
#CRYPTOASSETS #BLACKSTRAT – $BTC, H4
We already have 2 “yellows” H4 triggered. The first (16.08.23), was so violent that PA did not visit for the last. 29 200$ could be a reason ! The second (25798$), with a bullish divergence (BS Study indicator) confirming the current potential reversal situation.
Here is the point : regarding BS screener, H4 and Weekly timeframe are Neutral +, this confirm that the next potential Bullish signal might be a H4 (once the 50 will cross the 200, “stochastics” will talk by themselves)!
If rejected, LH13 is done and collapse potential (wave 3 could be confirmed). If accepted, this confirms that PA will break the VAH level (29600$). Forget “ABC” scenario….
#CRYPTOASSETS, BTC CME, D
Remind this chart ! There is 3 gaps missing :
> 35180$ – 34455$
> 21110$ – 20330$
> 9840$ – 9735$ (my favourite)
#CRYPTOASSETS, D
The second scenario will be confirmed if 29600$ is broken, than MM will swallow the LQ14 left above 30960$, with a potential to go close the GAP at 35k ! This will confirm the expectation of a new daily and weekly #Blackstrat signal.
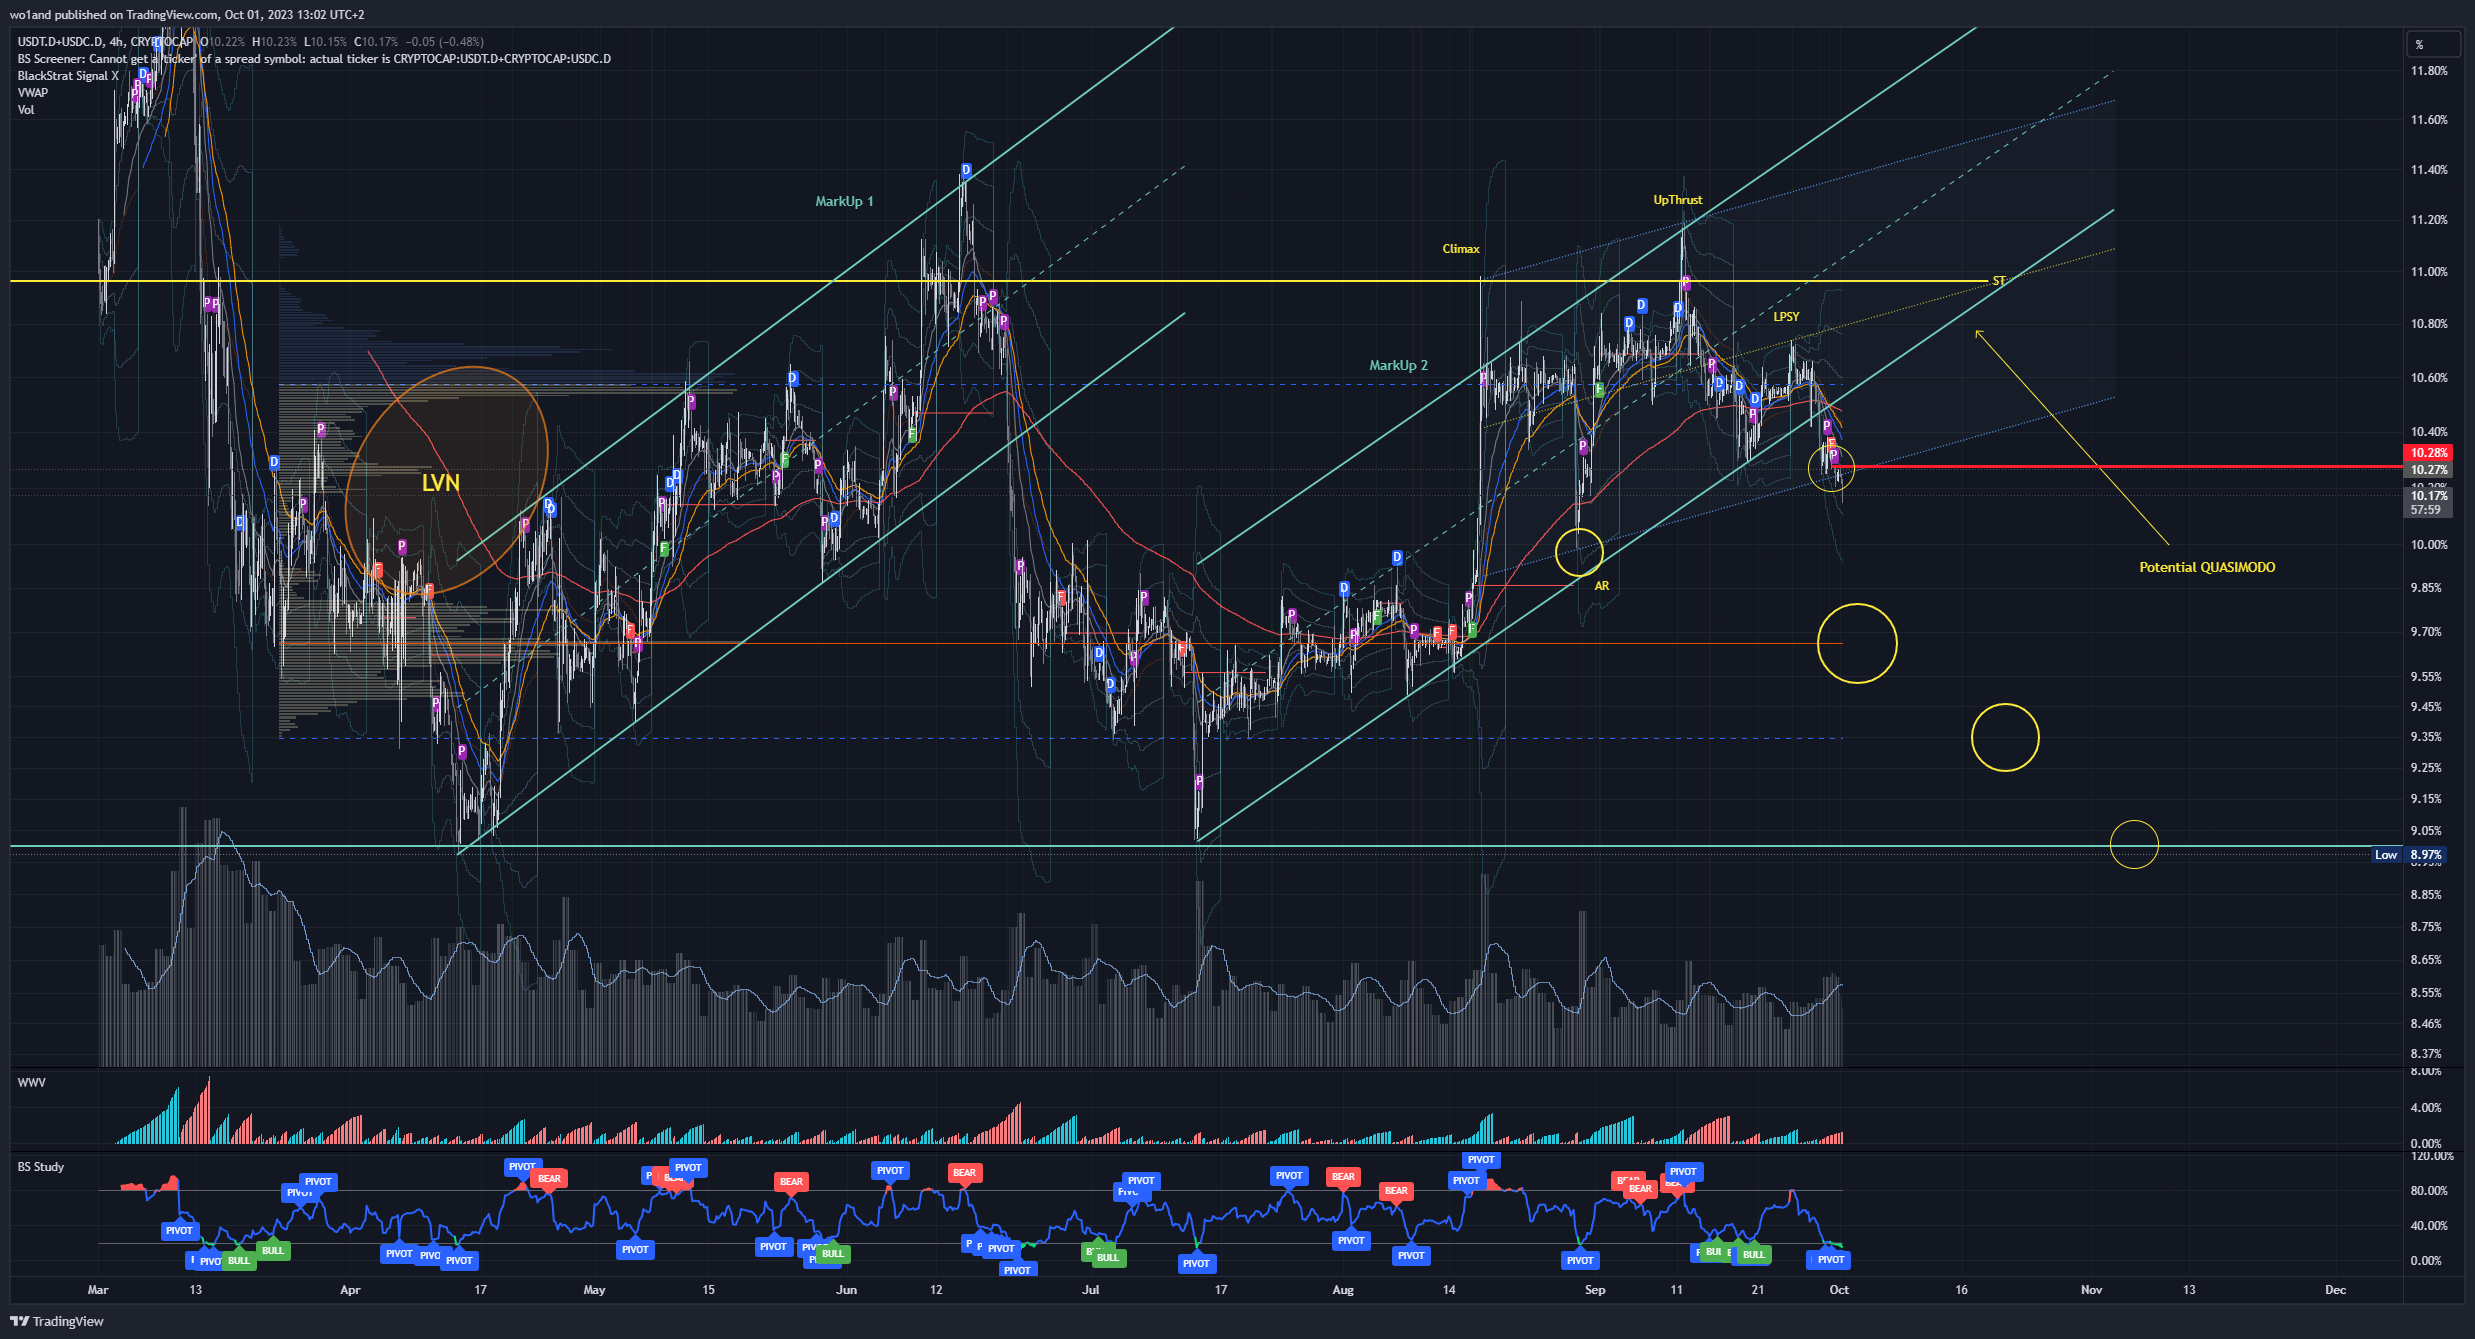
#CRYPTOASSETS, #DOMINANCE – $USDT+USDC, D
Regarding Stablecoin dominance, as long as it range between 11.19% and 8.95%, there is no real scenario of forecasting any future on Crypto Assets, excepts playing the range.
Double bottom is an option, and the “off-trail” of the initial fork could be considered as of mSOW15, possibly a triple TAP (back up before re integrate and go higher…. 16.74%.
Anyway, there are more than 25,000 tokens, coins. And how many times have I wrote that we need to clean up this market before potentially seeing it thrive.
There is no real rules on the Cryptomarket, even if MM behaviour is modeled as “casual”. As we saw it on March 20, when markets collapsed, they withdrew LQ to cover their positions… Guess what will happen in the next BlackSwan ?
Even if tools show us a potential move above 27.4k, the question is not to forecast the next Bull market, but the question is to know how far it go up before definitely collapse and clean up to rebuild on healthy foundations.
Don’t forget that there is a GAP above 35k…. but there are 2 left lower as well !
What do you see in this chart ?
I see a possible DCB16…. and you ?
- Fibonacci retracement ↩︎
- price action ↩︎
- extreme move with a violent pullback (Wyckoff phase A) ↩︎
- Market-makers (institutional investors) ↩︎
- Last Point of Support (Wyckoff accumulation fork) ↩︎
- Jump above the Creek (Wyckoff phase D in accumulation fork) ↩︎
- BackUp (SOW scenario – Wyckoff methodology) ↩︎
- CHangement of CHaracter – (Wyckoff Phase A methodology) ↩︎
- Point of Control (Volume profile methodology) ↩︎
- Last Point of Supply (Wyckoff distribution methodology) ↩︎
- Correction move (Elliot waves) ↩︎
- VAlue High (volume profile method) ↩︎
- Low High ↩︎
- Liquidity ↩︎
- minor Sign Of Weakness ↩︎
- Dead Cat Bounce ↩︎

